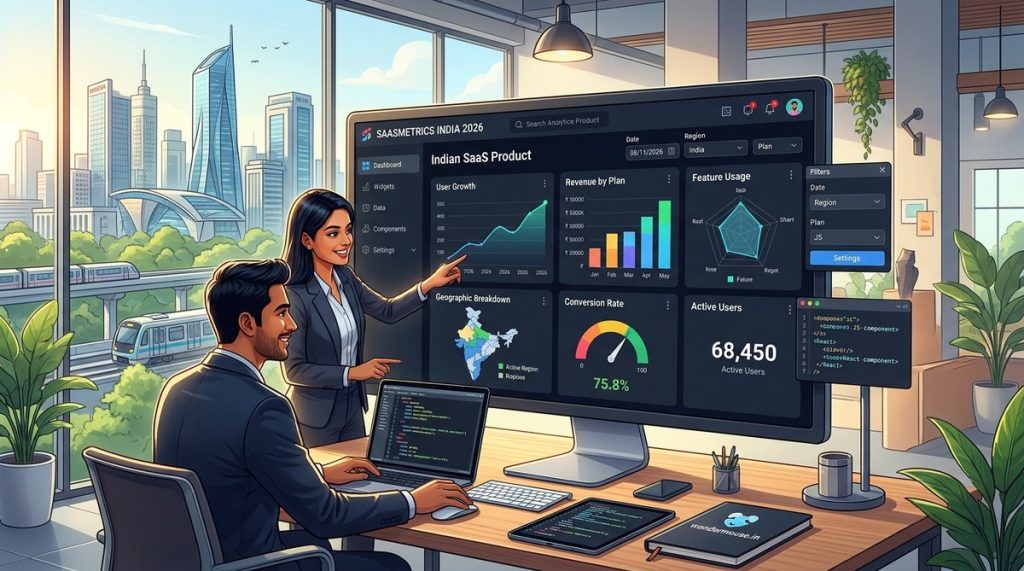
You are a product manager at a fast-growing Indian SaaS company. Your users are asking for better data. They want to see their usage patterns, understand their team’s activity, and make decisions without leaving your app. Off-the-shelf analytics tools feel generic. They show you metrics that matter to the vendor, not to your customers. The solution is a custom analytics dashboard built for your specific product and market.
Building your own dashboard is not about reinventing the wheel. It is about creating a wheel that fits your cart. For Indian SaaS products, this means handling regional data patterns, supporting multiple languages like Hindi or Tamil, and integrating with local payment gateways like Razorpay or BillDesk. This guide will walk you through the entire process, from planning to deployment, so you can deliver a dashboard that your users will actually love.
A custom analytics dashboard for your Indian SaaS product is not a luxury; it is a competitive necessity in 2026. By following a structured approach that prioritizes user needs, data security, and performance, you can build a dashboard that drives retention and revenue. Start small, iterate based on feedback, and use modern tech stacks to keep development costs manageable.
Why Off-the-Shelf Dashboards Fall Short in India
Generic analytics tools are built for a global audience. They assume your users speak English, use a specific currency, and follow Western business models. Indian SaaS products have unique requirements that these tools often ignore.
Consider a SaaS product that helps small businesses in Mumbai manage their inventory. The dashboard needs to show GST-compliant reports, support Hindi and Marathi, and handle peak usage during Diwali sales. A generic tool cannot do this out of the box. You end up spending more time customizing the tool than you would building your own.
Another issue is data residency. With India’s evolving data protection laws, keeping user data within the country is becoming mandatory. Many third-party analytics platforms store data on servers outside India. A custom dashboard gives you full control over where your data lives and how it is processed.
The Core Components of a Custom Analytics Dashboard
Before you write a single line of code, you need to understand the building blocks. Every analytics dashboard has four layers:
- Data ingestion layer: This collects data from your application, databases, and third-party services.
- Storage layer: This stores the data in a format that is optimized for querying, usually a time-series database or a data warehouse.
- Backend API layer: This processes requests from the frontend and returns aggregated data.
- Frontend visualization layer: This renders charts, tables, and filters that users interact with.
Each layer needs to be designed with your Indian audience in mind. For example, your data ingestion layer should handle time zones correctly. A user in Kolkata is 30 minutes ahead of a user in Mumbai. If your dashboard does not account for this, your metrics will be off.
Step-by-Step Guide to Building Your Dashboard
1. Define Your Metrics and Goals
Start by listing the questions your users ask most often. Do they want to know how many invoices they generated last month? Do they need to track team performance? Are they looking for churn predictions?
Write down the top five questions. These will become your core metrics. For an Indian edtech SaaS, this might include:
- Number of active students per course
- Average time spent on lessons
- Completion rates for assignments
- Revenue from new enrollments
- User feedback scores
2. Choose Your Tech Stack
Your tech stack should reflect your team’s skills and your budget. Here is a practical stack that works well for Indian startups:
| Component | Recommended Tool | Why It Works for Indian SaaS |
|---|---|---|
| Data storage | PostgreSQL with TimescaleDB | Handles time-series data well, open source, widely used in India |
| Backend API | Node.js with Express | Fast development, large talent pool in India |
| Frontend framework | React with Chart.js or Recharts | Lightweight, customizable, works on slow connections |
| Real-time updates | WebSockets via Socket.io | Essential for live dashboards during high-traffic events |
| Data processing | Python with Pandas | Great for complex aggregations and ML models |
This stack is affordable. You can run it on a single VPS server from a provider like DigitalOcean or AWS. For an early-stage startup, this keeps costs under control.
3. Design the Data Model
Your database schema needs to support your metrics. Create tables for events, users, and sessions. Each event should have a timestamp, user ID, event type, and relevant metadata.
Here is a simple example for a task management SaaS:
CREATE TABLE events (
  id SERIAL PRIMARY KEY,
  user_id INT NOT NULL,
  event_type VARCHAR(50) NOT NULL,
  metadata JSONB,
  created_at TIMESTAMPTZ DEFAULT NOW()
);

CREATE INDEX idx_events_user_time ON events (user_id, created_at);
Add indexes on columns that you will filter by, like user_id and created_at. This keeps your queries fast even as your data grows.
4. Build the Backend API
Your backend should expose endpoints that return aggregated data. For example, a /api/dashboard/summary endpoint might return total users, active users, and revenue for the current month.
Use caching to reduce database load. Redis is a popular choice. Cache results for five minutes, and invalidate the cache when new data arrives.
5. Create the Frontend
Start with a wireframe. Sketch out where each chart will go. Group related metrics together. For a SaaS dashboard, a common layout is:
- Top row: Key performance indicators (KPIs) like MRR, active users, churn rate
- Middle section: Time-series charts showing trends over days or weeks
- Bottom section: Tables with drill-down capability
Use responsive design. Many of your users in India access your product on mobile devices. A dashboard that looks great on a laptop but breaks on a phone will frustrate them.
6. Add Multi-Tenancy Support
Your dashboard serves multiple customers, each with their own data. This is called multi-tenancy. You can implement it by adding a tenant_id column to every table. Every query must filter by this column.
SELECT * FROM events WHERE tenant_id = :current_tenant AND created_at > NOW() - INTERVAL '30 days';
Test this thoroughly. A bug that leaks data between tenants is a compliance nightmare.
Common Mistakes to Avoid
Building a custom analytics dashboard is rewarding, but it is easy to make mistakes. Here are the most common ones and how to avoid them:
| Mistake | Why It Hurts | How to Fix It |
|---|---|---|
| Showing too many metrics | Users feel overwhelmed | Limit the dashboard to five core metrics |
| Ignoring mobile users | 70% of Indian users access via mobile | Test on real devices, not just emulators |
| Skipping data validation | Dirty data leads to wrong insights | Add validation at the ingestion point |
| Forgetting about time zones | Reports show wrong hours | Store all timestamps in UTC, convert on the frontend |
| Not planning for scale | Dashboard slows down as data grows | Use database indexes and caching from day one |
“The best dashboard is the one your users actually check every day. If it is cluttered or slow, they will stop using it. Focus on speed and clarity first.” – Ravi Sharma, founder of a Bangalore-based SaaS startup.
How to Handle Indian-Specific Challenges
Indian SaaS products face unique challenges that global guides do not cover. Here is how to handle them:
Language support: Your dashboard should support at least English and Hindi. Use a translation library like i18next. Let users switch languages from a dropdown. If your product serves regional markets, add Tamil, Telugu, or Marathi.
Payment data: Integrate with Razorpay or BillDesk APIs to pull transaction data. Show metrics like successful payments, failed transactions, and refund rates. This is critical for Indian ecommerce SaaS products.
Festival-based trends: Indian festivals like Diwali and Holi cause massive spikes in user activity. Your dashboard should highlight these periods. Add annotations to your charts that mark festival dates. This helps users understand why their metrics changed.
Low-bandwidth optimization: Many users in tier-2 and tier-3 cities have slow internet. Compress your API responses using gzip. Use lazy loading for charts. Only load the data that the user can see on their screen.
Measuring Success
Once your dashboard is live, track these metrics to see if it is working:
- Daily active users: How many users open the dashboard each day?
- Time on dashboard: Are they spending enough time to gain insights?
- Feature adoption: Which charts are clicked most often?
- Support tickets: Are users asking fewer questions about their data?
Use these numbers to iterate. If users ignore a chart, remove it. If they keep asking for a specific metric, add it.
Your Next Steps
Building a custom analytics dashboard for your Indian SaaS product is a strategic investment. It gives you control over your data, aligns with local regulations, and provides a better experience for your users.
Start with a minimum viable dashboard that shows just three metrics. Launch it to a small group of beta users. Collect feedback. Then expand.
If you want to learn more about the underlying technologies, check out our guide on essential web development tools every startup should use. You might also find our article on mastering user experience in web design for better conversion rates helpful for polishing your dashboard’s interface.
Building for the Long Term
A custom analytics dashboard is not a one-time project. It grows with your product. As you add new features, your dashboard should evolve too. Plan for regular updates. Set aside time each quarter to review your metrics and add new ones.
The effort you put in today will pay off in user retention and satisfaction. Your customers will appreciate having a dashboard that speaks their language, respects their data, and shows them what matters. That is the kind of product that wins in the Indian market.
Go ahead. Start building. Your users are waiting.