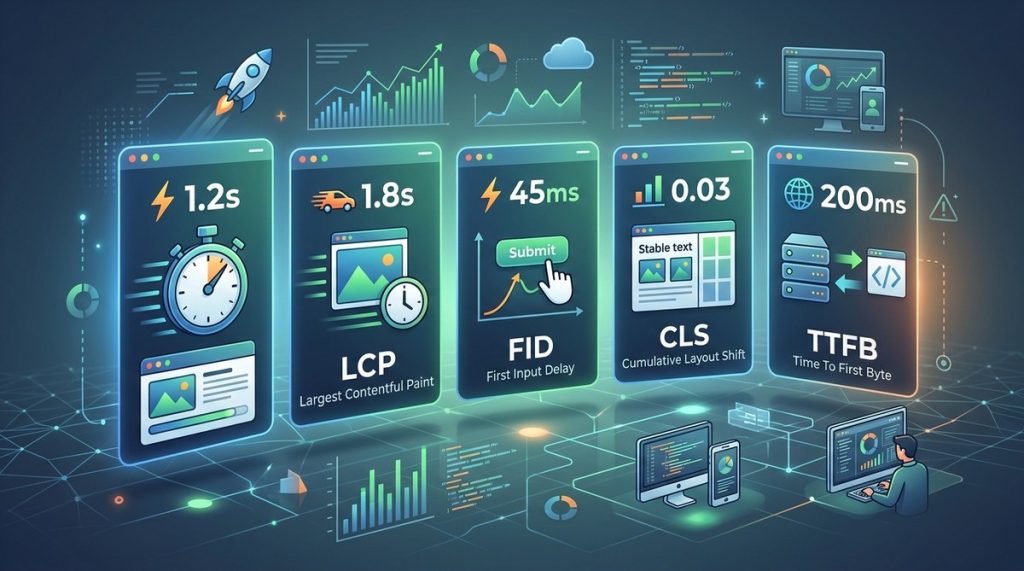
Building a fast, reliable website in 2026 is no longer just a nice to have. It is the difference between a customer completing a purchase on Flipkart or bouncing to a competitor. For developers in India, where mobile data can still be patchy and device variety is huge, tracking the right web performance metrics has become a survival skill. Google’s search algorithms keep evolving, user expectations rise every quarter, and a slow site directly impacts your revenue. So which numbers should you actually watch? Let’s break down the five critical metrics that every front end or full stack developer must monitor in 2026 to keep their sites fast, responsive, and user friendly.
Web performance in 2026 revolves around user centric metrics: Largest Contentful Paint, Interaction to Next Paint, Cumulative Layout Shift, First Input Delay is now fully replaced by INP, and Time to First Byte. Core Web Vitals are still the baseline, but new signals like smoothness and responsiveness matter more. Indian developers must optimise for low end devices and variable network speeds rather than only desktop Chrome.
Why Your Choice of Metrics Defines User Experience in 2026
A few years ago, developers often measured page load time with a single number. That approach is dead. In 2026, performance is a multi dimensional story. Google’s ranking system uses Core Web Vitals, but real users also care about how the page feels during scrolling, tapping, and typing. A website might load its main content in two seconds, yet feel janky when a user tries to fill a form or scroll a product list. If you ignore the finer details of interactivity, you will lose users in India, where mobile first browsing is the norm. Understanding the right metrics helps you prioritise fixes that actually improve the experience for your audience.
The Five Metrics You Cannot Ignore
Let’s walk through each metric. I’ll explain what it measures, why it matters, and how to improve it. These five form the backbone of any modern performance monitoring strategy.
1. Largest Contentful Paint (LCP)
LCP measures when the largest visible element on the screen (like a hero image or a big heading) finishes rendering. In 2026, the target is under 2.5 seconds for a good user experience. For a travel booking site like MakeMyTrip, a slow LCP means visitors see a blank screen for too long and leave. To improve LCP, optimise images (use WebP or AVIF), preload key resources, and minimise render blocking CSS or JavaScript.
2. Interaction to Next Paint (INP)
INP replaces First Input Delay (FID) in 2024, and by 2026 it is the definitive metric for responsiveness. It measures the time from when a user interacts (click, tap, keypress) to the next visual update. A low INP (under 200 milliseconds) ensures your site feels snappy. For an Indian fintech app handling UPI payments, a high INP could cause users to tap multiple times, leading to failed transactions or frustration. Reduce INP by breaking up long JavaScript tasks, using web workers, and deferring non critical scripts.
3. Cumulative Layout Shift (CLS)
CLS quantifies visual stability. It tracks unexpected layout shifts during the page load. A shift happens when an image loads without dimensions and pushes a button down, causing a user to accidentally click something else. In 2026, a CLS score below 0.1 is considered good. Indian news websites often suffer from high CLS because of late loading ads. Fix it by setting explicit width and height on all media, using CSS aspect ratio boxes, and reserving space for dynamic content.
4. Time to First Byte (TTFB)
TTFB measures how long the browser waits to receive the first byte of data from the server. It reflects server responsiveness and network latency. A high TTFB (over 800 ms) on a server located in Mumbai can hurt users in Delhi if you lack a CDN. Improve TTFB by using a content delivery network like Cloudflare, optimising backend queries, and enabling server side caching. For sites that serve many Indian users, consider edge computing or a CDN with nodes in multiple Indian cities.
5. Browser Smoothness and Responsiveness (New Signal)
Beyond Core Web Vitals, browser vendors are pushing a new metric: smoothness of scrolling and frame rate. A page might pass LCP, INP, and CLS tests but still stutter during long scrolls. This is particularly visible on low end Android devices common in India. Monitor frame drops and long tasks using the Performance API. Defer off screen images, avoid heavy animations on mobile, and use content-visibility: auto to skip rendering hidden sections.
How to Track These Metrics with Real User Monitoring
You cannot rely only on lab data from Lighthouse or PageSpeed Insights. In 2026, real user monitoring (RUM) is essential because it captures actual experiences from visitors using different devices, browsers, and network types. For Indian developers, this is critical because a site that works well on a Samsung Galaxy S24 in 5G may fail on a budget phone on Jio’s 4G. Use tools like Google’s CrUX (Chrome User Experience Report), Web Vitals library, or commercial RUM solutions to collect field data. Set up dashboards that show percentiles (p75, p95) rather than averages, because outliers matter.
Common Mistakes Developers Make When Monitoring Performance
- Ignoring mobile first metrics: You optimise for desktop Chrome but forget that 80% of your Indian traffic comes from mobile.
- Chasing perfection: Trying to get a perfect Lighthouse score while ignoring real user frustration.
- Looking at averages: A 2.5 second average LCP can hide that 30% of users experience 6 seconds.
- Not measuring INP after 2024: Some developers still rely on FID which is no longer a Core Web Vital.
- Skipping CLS for dynamic content: Ads, embeds, and images without dimensions cause shifts that kill user trust.
A Practical Table for Metric Priorities
| Metric | Good Target (2026) | Common Mistake | Fix Approach |
|---|---|---|---|
| LCP | < 2.5s | Large uncompressed hero images | Use responsive images with srcset, preload |
| INP | < 200ms | Heavy JavaScript on main thread | Defer scripts, use web workers |
| CLS | < 0.1 | No dimensions on ads | Reserve space with placeholder divs |
| TTFB | < 800ms | Single server without CDN | Use edge caching, upgrade hosting |
| Smoothness | No jank during scroll | Too many DOM elements | Use virtual lists, limit reflows |
“In 2026, the line between performance and user experience has completely vanished. You cannot separate them. Every millisecond you shave off your INP or CLS directly translates to higher conversions and lower bounce rates. The developers who treat performance as a feature, not a bug, will win the Indian market.” – Anjali Sharma, Performance Engineer at Paytm
Four Steps to Start Monitoring Effectively
- Choose your RUM tool: Integrate the Web Vitals library into your site to collect real data from Indian users. Set up an analytics endpoint or use a third party service.
- Set up alert thresholds: Configure alerts for when your p75 LCP goes above 3 seconds or p75 INP above 300ms. Act fast before the dip becomes a crisis.
- Create a performance budget: Define maximum sizes for JavaScript bundles, images, and total page weight. Enforce this in your CI pipeline.
- Run monthly performance audits: Using both lab (Lighthouse in a controlled environment) and field data (CrUX), compare trends month over month. Prioritise fixes that impact the most users.
Make Performance Monitoring a Habit in 2026
The landscape of web performance metrics will keep shifting. But the core idea remains the same: measure what your users actually experience, not what you assume. Start by monitoring the five metrics we covered: LCP, INP, CLS, TTFB, and smoothness. Build a feedback loop that connects data to code changes. And never stop optimising for the slowest device and the weakest network in your audience. Your users in India deserve a site that loads fast, responds instantly, and stays stable. By tracking the right metrics, you can give them exactly that. If you want to go deeper on improving your site’s ranking, check out our guide on how to optimize Core Web Vitals for better rankings in 2026. For a broader view of what’s changing in the Indian web, read about top web development trends to boost your business in 2026. Now go run that audit, your users are waiting.